BOTOX® IMPORTANT INFORMATION
IMPORTANT SAFETY INFORMATION, INCLUDING BOXED WARNING
WARNING: DISTANT SPREAD OF TOXIN EFFECT
Postmarketing reports indicate that the effects of BOTOX and all botulinum toxin products may spread from the area of injection to produce symptoms consistent with botulinum toxin effects. These may include asthenia, generalized muscle weakness, diplopia, ptosis, dysphagia, dysphonia, dysarthria, urinary incontinence, and breathing difficulties. These symptoms have been reported hours to weeks after injection. Swallowing and breathing difficulties can be life threatening, and there have been reports of death. The risk of symptoms is probably greatest in children treated for spasticity, but symptoms can also occur in adults treated for spasticity and other conditions, particularly in those patients who have an underlying condition that would predispose them to these symptoms. In unapproved uses and approved indications, cases of spread of effect have been reported at doses comparable to those used to treat cervical dystonia and spasticity and at lower doses.
INDICATIONS
Adult Bladder Dysfunction
Overactive Bladder
BOTOX for injection is indicated for the treatment of overactive bladder with symptoms of urge urinary incontinence, urgency, and frequency in adults who have an inadequate response to or are intolerant of an anticholinergic medication.
Detrusor Overactivity Associated With a Neurologic Condition
BOTOX is indicated for the treatment of urinary incontinence due to detrusor overactivity associated with a neurologic condition (eg, SCI, MS) in adults who have an inadequate response to or are intolerant of an anticholinergic medication.
Pediatric Detrusor Overactivity Associated With a Neurologic Condition
BOTOX is indicated for the treatment of neurogenic detrusor overactivity (NDO) in pediatric patients 5 years of age and older who have an inadequate response to or are intolerant of anticholinergic medication.
Chronic Migraine
BOTOX is indicated for the prophylaxis of headaches in adult patients with chronic migraine (≥15 days per month with headache lasting 4 hours a day or longer).
Limitations of Use
Safety and effectiveness have not been established for the prophylaxis of episodic migraine (14 headache days or fewer per month) in 7 placebo-controlled studies.
Spasticity
BOTOX is indicated for the treatment of spasticity in patients 2 years of age and older.
Limitations of Use
BOTOX has not been shown to improve upper extremity functional abilities or range of motion at a joint affected by a fixed contracture.
Cervical Dystonia
BOTOX is indicated for the treatment of adults with cervical dystonia to reduce the severity of abnormal head position and neck pain associated with cervical dystonia.
Blepharospasm and Strabismus
BOTOX is indicated for the treatment of strabismus and blepharospasm associated with dystonia, including benign essential blepharospasm or VII nerve disorders in patients 12 years of age and older.
Primary Axillary Hyperhidrosis
BOTOX is indicated for the treatment of severe primary axillary hyperhidrosis that is inadequately managed with topical agents.
Limitations of Use
The safety and effectiveness of BOTOX for hyperhidrosis in other body areas have not been established. Weakness of hand muscles and blepharoptosis may occur in patients who receive BOTOX for palmar hyperhidrosis and facial hyperhidrosis, respectively. Patients should be evaluated for potential causes of secondary hyperhidrosis (eg, hyperthyroidism) to avoid symptomatic treatment of hyperhidrosis without the diagnosis and/or treatment of the underlying disease.
Safety and effectiveness of BOTOX have not been established for the treatment of axillary hyperhidrosis in pediatric patients under age 18.
IMPORTANT SAFETY INFORMATION (continued)
CONTRAINDICATIONS
BOTOX is contraindicated in the presence of infection at the proposed injection site(s) and in patients who are hypersensitive to any botulinum toxin product or to any of the components in the formulation.
BOTOX is contraindicated for intradetrusor injection in patients with a urinary tract infection (UTI), or in patients with urinary retention or post-void residual (PVR) urine volume >200 mL who are not routinely performing clean intermittent self-catheterization (CIC).
WARNINGS AND PRECAUTIONS
Spread of Toxin Effect
See Boxed Warning.
No definitive serious adverse event reports of distant spread of toxin effect associated with BOTOX for blepharospasm at the recommended dose (30 Units and below), severe primary axillary hyperhidrosis at the recommended dose (100 Units), strabismus, or for chronic migraine at the labeled doses have been reported.
Lack of Interchangeability Between Botulinum Toxin Products
The potency Units of BOTOX are specific to the preparation and assay method utilized. They are not interchangeable with other preparations of botulinum toxin products and, therefore, Units of biological activity of BOTOX cannot be compared to nor converted into Units of any other botulinum toxin products assessed with any other specific assay method.
Serious Adverse Reactions With Unapproved Use
Serious adverse reactions, including excessive weakness, dysphagia, and aspiration pneumonia, with some adverse reactions associated with fatal outcomes, have been reported in patients who received BOTOX injections for unapproved uses. In these cases, the adverse reactions were not necessarily related to distant spread of toxin, but may have resulted from the administration of BOTOX to the site of injection and/or adjacent structures. In several of the cases, patients had preexisting dysphagia or other significant disabilities. There is insufficient information to identify factors associated with an increased risk for adverse reactions associated with the unapproved uses of BOTOX. The safety and effectiveness of BOTOX for unapproved uses have not been established.
Hypersensitivity Reactions
Serious and/or immediate hypersensitivity reactions have been reported. These reactions include anaphylaxis, serum sickness, urticaria, soft-tissue edema, and dyspnea. If such a reaction occurs, further injection of BOTOX should be discontinued and appropriate medical therapy immediately instituted. One fatal case of anaphylaxis has been reported in which lidocaine was used as the diluent, and consequently, the causal agent cannot be reliably determined.
Increased Risk of Clinically Significant Effects With Preexisting Neuromuscular Disorders
Individuals with peripheral motor neuropathic diseases, amyotrophic lateral sclerosis (ALS), or neuromuscular junction disorders (eg, myasthenia gravis or Lambert-Eaton syndrome) should be monitored when given botulinum toxin. Patients with known or unrecognized neuromuscular disorders or neuromuscular junction disorders may be at increased risk of clinically significant effects, including generalized muscle weakness, diplopia, ptosis, dysphonia, dysarthria, severe dysphagia, and respiratory compromise from therapeutic doses of BOTOX (see Warnings and Precautions).
Dysphagia and Breathing Difficulties
Treatment with BOTOX and other botulinum toxin products can result in swallowing or breathing difficulties. Patients with preexisting swallowing or breathing difficulties may be more susceptible to these complications. In most cases, this is a consequence of weakening of muscles in the area of injection that are involved in breathing or oropharyngeal muscles that control swallowing or breathing (see Boxed Warning).
Pulmonary Effects of BOTOX in Patients With Compromised Respiratory Status Treated for Spasticity or for Detrusor Overactivity Associated With a Neurologic Condition
Patients with compromised respiratory status treated with BOTOX for spasticity or detrusor overactivity associated with a neurologic condition should be monitored closely.
Corneal Exposure and Ulceration in Patients Treated With BOTOX for Blepharospasm
Reduced blinking from BOTOX injection of the orbicularis muscle can lead to corneal exposure, persistent epithelial defect, and corneal ulceration, especially in patients with VII nerve disorders.
Retrobulbar Hemorrhages in Patients Treated With BOTOX for Strabismus
During the administration of BOTOX for the treatment of strabismus, retrobulbar hemorrhages sufficient to compromise retinal circulation have occurred. It is recommended that appropriate instruments to decompress the orbit be accessible.
Bronchitis and Upper Respiratory Tract Infections in Patients Treated for Spasticity
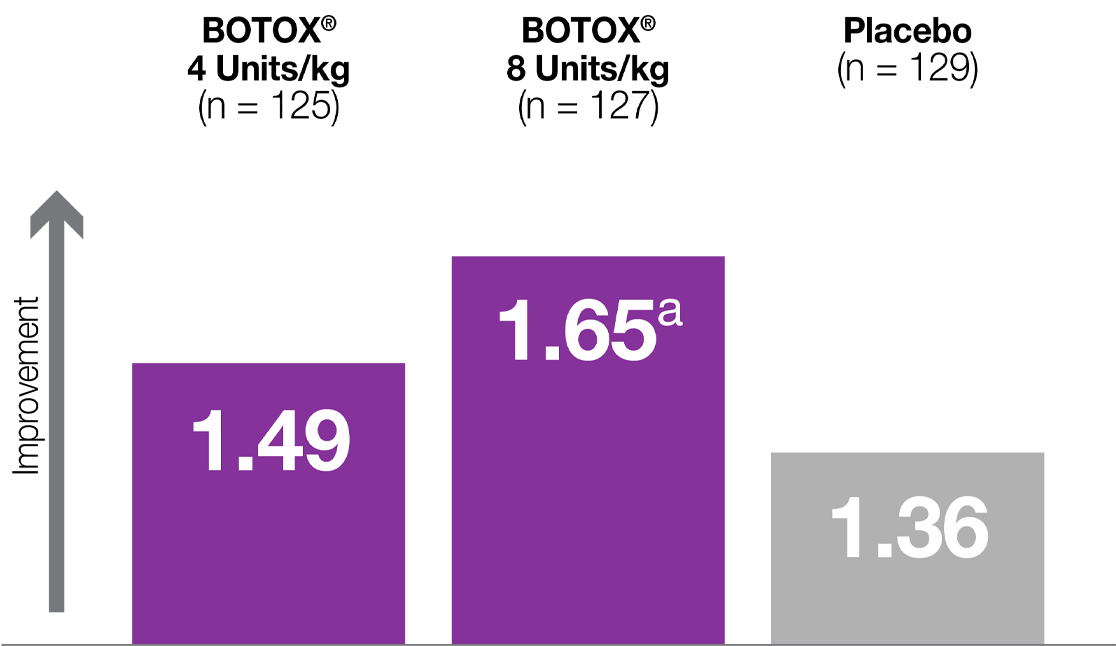
Bronchitis was reported more frequently as an adverse reaction in adult patients treated for upper limb spasticity with BOTOX (3% at 251 Units to 360 Units total dose) compared to placebo (1%). In adult patients with reduced lung function treated for upper limb spasticity, upper respiratory tract infections were also reported more frequently as adverse reactions in patients treated with BOTOX (11% at 360 Units total dose; 8% at 240 Units total dose) compared to placebo (6%). In adult patients treated for lower limb spasticity, upper respiratory tract infections were reported more frequently as an adverse reaction in patients treated with BOTOX (2% at 300 Units to 400 Units total dose) compared to placebo (1%). In pediatric patients treated for upper limb spasticity, upper respiratory tract infections were reported more frequently as an adverse reaction in patients treated with BOTOX (17% at 6 Units/kg and 10% at 3 Units/kg) compared to placebo (9%). In pediatric patients treated for lower limb spasticity, upper respiratory tract infection was not reported with an incidence greater than placebo.
Autonomic Dysreflexia in Patients Treated for Detrusor Overactivity Associated With a Neurologic Condition
Autonomic dysreflexia associated with intradetrusor injections of BOTOX could occur in patients treated for detrusor overactivity associated with a neurologic condition and may require prompt medical therapy. In clinical trials, the incidence of autonomic dysreflexia was greater in adult patients treated with BOTOX 200 Units compared with placebo (1.5% vs 0.4%, respectively).
Urinary Tract Infections in Patients With Overactive Bladder
BOTOX increases the incidence of UTI. Clinical trials for overactive bladder excluded patients with more than 2 UTIs in the past 6 months and those taking antibiotics chronically due to recurrent UTIs. Use of BOTOX for the treatment of overactive bladder in such patients and in patients with multiple recurrent UTIs during treatment should only be considered when the benefit is likely to outweigh the potential risk.
Urinary Retention in Adults Treated for Bladder Dysfunction
Due to the risk of urinary retention, treat only patients who are willing and able to initiate catheterization posttreatment, if required, for urinary retention.
In patients who are not catheterizing, PVR urine volume should be assessed within 2 weeks posttreatment and periodically as medically appropriate up to 12 weeks, particularly in patients with multiple sclerosis or diabetes mellitus. Depending on patient symptoms, institute catheterization if PVR urine volume exceeds 200 mL and continue until PVR falls below 200 mL. Instruct patients to contact their physician if they experience difficulty in voiding as catheterization may be required.
Overactive Bladder
In clinical trials, 6.5% of patients (36/552) initiated CIC for urinary retention following treatment with BOTOX 100 Units, as compared to 0.4% of patients (2/542) treated with placebo. The median duration of catheterization for patients treated with BOTOX 100 Units was 63 days (minimum 1 day to maximum 214 days), as compared to a median duration of 11 days (minimum 3 days to maximum 18 days) for patients receiving placebo.
Patients with diabetes mellitus treated with BOTOX were more likely to develop urinary retention than nondiabetics. In clinical trials, 12.3% of patients (10/81) with diabetes developed urinary retention following treatment with BOTOX 100 Units vs 0% of patients (0/69) treated with placebo. In patients without diabetes, 6.3% of patients (33/526) developed urinary retention following treatment with BOTOX 100 Units vs 0.6% of patients (3/516) treated with placebo.
Adult Detrusor Overactivity Associated With a Neurologic Condition
In clinical trials, 30.6% of adult patients (33/108) who were not using CIC prior to injection required catheterization for urinary retention following treatment with BOTOX 200 Units, as compared to 6.7% of patients (7/104) treated with placebo. The median duration of postinjection catheterization for these patients treated with BOTOX 200 Units (n = 33) was 289 days (minimum 1 day to maximum 530 days), as compared to a median duration of 358 days (minimum 2 days to maximum 379 days) for patients receiving placebo (n = 7).
Among adult patients not using CIC at baseline, those with multiple sclerosis were more likely to require CIC postinjection than those with spinal cord injury.
Human Albumin and Transmission of Viral Diseases
This product contains albumin, a derivative of human blood. Based on effective donor screening and product manufacturing processes, it carries an extremely remote risk for transmission of viral diseases and variant Creutzfeldt-Jakob disease (vCJD). There is a theoretical risk for transmission of Creutzfeldt-Jakob disease (CJD), but if that risk actually exists, the risk of transmission would also be considered extremely remote. No cases of transmission of viral diseases, CJD, or vCJD have ever been identified for licensed albumin or albumin contained in other licensed products.
ADVERSE REACTIONS
Adverse reactions to BOTOX for injection are discussed in greater detail in the following sections: Boxed Warning, Contraindications, and Warnings and Precautions.
Overactive Bladder
The most frequently reported adverse reactions for overactive bladder occurring within 12 weeks of injection include UTI (BOTOX 18%, placebo 6%); dysuria (BOTOX 9%, placebo 7%); urinary retention (BOTOX 6%, placebo 0%); bacteriuria (BOTOX 4%, placebo 2%); and residual urine volume (BOTOX 3%, placebo 0%).
A higher incidence of UTI was observed in patients with diabetes mellitus treated with BOTOX 100 Units and placebo than nondiabetics.
The incidence of UTI increased in patients who experienced a maximum PVR urine volume ≥200 mL following BOTOX injection compared to those with a maximum PVR <200 mL following BOTOX injection, 44% vs 23%, respectively.
Adult Detrusor Overactivity Associated With a Neurologic Condition
The most frequently reported adverse reactions within 12 weeks of BOTOX injection for detrusor overactivity associated with a neurologic condition include UTI (BOTOX 24%, placebo 17%); urinary retention (BOTOX 17%, placebo 3%); and hematuria (BOTOX 4%, placebo 3%).
The following adverse event rates were reported at any time following initial injection and prior to reinjection or study exit (median duration of 44 weeks of exposure): UTIs (49%), urinary retention (17%), constipation (4%), muscular weakness (4%), dysuria (4%), fall (3%), gait disturbance (3%), and muscle spasm (2%).
Pediatric Detrusor Overactivity Associated With a Neurologic Condition
The most frequently reported adverse reactions during the 12 weeks following BOTOX injection of 200 Units for pediatric detrusor overactivity associated with a neurologic condition include bacteriuria (20%), UTI (7%), leukocyturia (7%), and hematuria (3%).
The most common adverse reactions in patients who received BOTOX 6 Units/kg and less than a total dose of 200 Units were UTI, bacteriuria, and hematuria.
These patients were not adequately managed with at least one anticholinergic agent and were using CIC at baseline.
Chronic Migraine
The most frequently reported adverse reactions following injection of BOTOX for chronic migraine vs placebo include, respectively, neck pain (9% vs 3%); headache (5% vs 3%); eyelid ptosis (4% vs <1%); migraine (4% vs 3%); muscular weakness (4% vs <1%); musculoskeletal stiffness (4% vs 1%); bronchitis (3% vs 2%); injection-site pain (3% vs 2%); musculoskeletal pain (3% vs 1%); myalgia (3% vs 1%); facial paresis (2% vs 0%); hypertension (2% vs 1%); and muscle spasms (2% vs 1%).
Severe worsening of migraine requiring hospitalization occurred in approximately 1% of BOTOX treated patients in study 1 and study 2, usually within the first week after treatment, compared with 0.3% of placebo-treated patients.
Adult Upper Limb Spasticity
The most frequently reported adverse reactions following injection of BOTOX for upper limb spasticity include pain in extremity, muscular weakness, fatigue, nausea, and bronchitis.
Adult Lower Limb Spasticity
The most frequently reported adverse reactions following injection of BOTOX for lower limb spasticity include arthralgia, back pain, myalgia, upper respiratory tract infection, and injection-site pain.
Pediatric Upper Limb Spasticity
The most frequently reported adverse reactions following injection of BOTOX in pediatric upper limb spasticity include upper respiratory tract infection (includes upper respiratory tract infection and viral upper respiratory tract infection), injection-site pain, nausea, constipation, rhinorrhea, nasal congestion, and seizure (includes seizure and partial seizure).
Pediatric Lower Limb Spasticity
The most frequently reported adverse reactions following injection of BOTOX in pediatric lower limb spasticity include injection-site erythema, injection-site pain, oropharyngeal pain, ligament sprain, skin abrasion, and decreased appetite.
Cervical Dystonia
The most frequently reported adverse reactions following injection of BOTOX for cervical dystonia include dysphagia (19%), upper respiratory infection (12%), neck pain (11%), and headache (11%).
Blepharospasm
The most frequently reported adverse reactions following injection of BOTOX for blepharospasm include ptosis (21%), superficial punctate keratitis (6%), and eye dryness (6%).
Strabismus
The most frequently reported adverse events following injection of BOTOX for strabismus include ptosis (1% after inferior rectus injections, 16% after horizontal rectus injections, and 38% after superior rectus injections) and vertical deviation (17%).
Primary Axillary Hyperhidrosis
The most frequently reported adverse events (3%-10% of adult patients) following injection of BOTOX for severe primary axillary hyperhidrosis in double-blind studies include injection-site pain and hemorrhage, nonaxillary sweating, infection, pharyngitis, flu syndrome, headache, fever, neck or back pain, pruritus, and anxiety.
Postmarketing Experience
Adverse reactions that have been identified during postapproval use of BOTOX are discussed in greater detail in Postmarketing Experience (Section 6.3 of the Prescribing Information).
There have been spontaneous reports of death, sometimes associated with dysphagia, pneumonia, and/or other significant debility or anaphylaxis, after treatment with botulinum toxin. There have also been reports of adverse events involving the cardiovascular system, including arrhythmia and myocardial infarction, some with fatal outcomes. Some of these patients had risk factors, including cardiovascular disease. The exact relationship of these events to the botulinum toxin injection has not been established.
DRUG INTERACTIONS
Co-administration of BOTOX and other agents interfering with neuromuscular transmission (eg, aminoglycosides, curare-like compounds) should only be performed with caution as the effect of the toxin may be potentiated. Use of anticholinergic drugs after administration of BOTOX may potentiate systemic anticholinergic effects. The effect of administering different botulinum neurotoxin products at the same time or within several months of each other is unknown. Excessive neuromuscular weakness may be exacerbated by administration of another botulinum toxin prior to the resolution of the effects of a previously administered botulinum toxin. Excessive weakness may also be exaggerated by administration of a muscle relaxant before or after administration of BOTOX.
Please see BOTOX® full Prescribing Information, including Boxed Warning and Medication Guide.
US-BTX-220125
.png)